
How we report accuracy
Every map we deliver says how accurate it is, measured on that job. If something wasn't checked, the report says so in plain words.
Measured against the ground, not the model
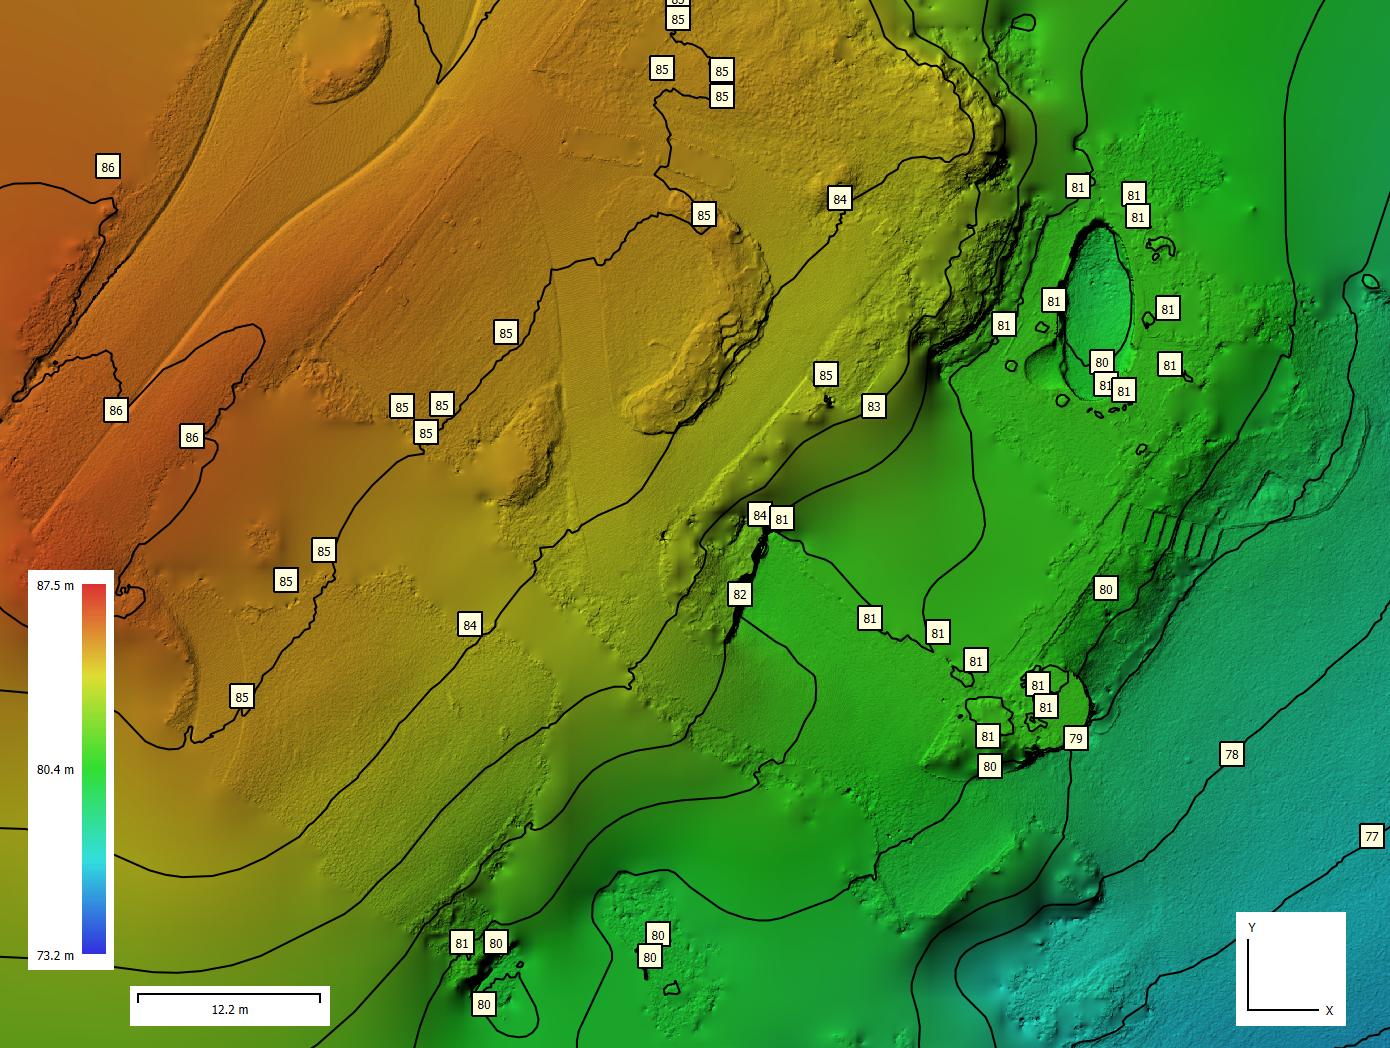
Before we fly, we mark points on the ground and measure their positions with RTK GNSS. Some of them, the control points, are used to tie the model to real-world coordinates.
The others, the checkpoints, are kept out of processing entirely. Once the map is built, we compare it with each checkpoint. Because the model never saw those points, the comparison is an honest test of how well it matches the ground.
We use at least five checkpoints on a standard job, spread across the site.
RTK positioning on the drone doesn't prove a map is accurate on its own. Independent checkpoints do, which is why every report shows them.
What the report states
Every report has an accuracy section, worked out directly from the measurements, not typed in by hand.
The number used, and each one listed with its measured level, the map's level and the difference.
The root mean square error, the average difference (any consistent offset) and the largest single difference.
The horizontal error at the checkpoints when it was measured. When it wasn't, the report says "not checked".
The result against the limits agreed for the job. A map that fails, or wasn't checked, is marked draft and not issued.
The horizontal system and height datum, where the inputs came from, and any transformation applied along the way.
For volumes and change, the base and method used, and which kind of accuracy the figure depends on.
Vertical accuracy was checked at n checkpoints designated as independent in the control file. Vertical RMSE __ m, mean __ m, largest difference __ m. Result against the job's limits: PASS. Horizontal accuracy was not checked in this report.
Two kinds of accuracy, and which one matters
Absolute accuracy is how well one map matches real-world coordinates. That's what the checkpoints measure, and it's what matters when you compare our map with a design or with someone else's levels.
Relative accuracy is how well two of our captures of the same site agree with each other. It's what matters for change and volumes between visits: a consistent 2 cm difference between two captures over a hectare looks like 200 m³ of material that never moved. Where a job compares captures, we measure that agreement on ground that hasn't changed, such as sealed roads and slabs, and report it.
Why we don't measure growth from colour
A common way to show plant growth is to count the "green" pixels in two aerial maps and report the difference. We tried it on a garden we map regularly, the slope below the house in our Cooroy House case study, comparing December 2025 with September 2026.
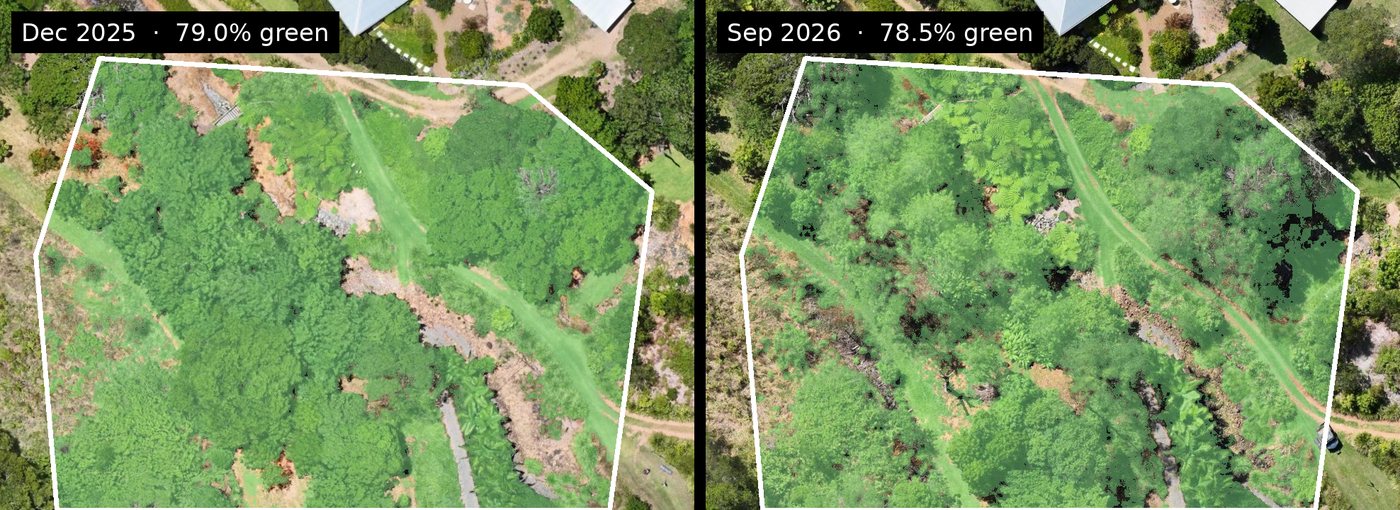
The count says almost nothing changed, yet you can see bare patches filling in. Shadows under thicker canopy drop out of the count, and the season and light differ between visits. Moving the cut-off for what counts as green swung the result from 3% more cover to 11% less.
A number that flips with one setting isn't a measurement, so we don't sell it. Growth is measured as height change between two elevation models, and only after both captures are shown to agree on ground that hasn't changed.
Every site is different
A few site conditions can affect the detail in the captured data. If any of them apply to your site, we'll let you know when we plan the job, and again in your report.
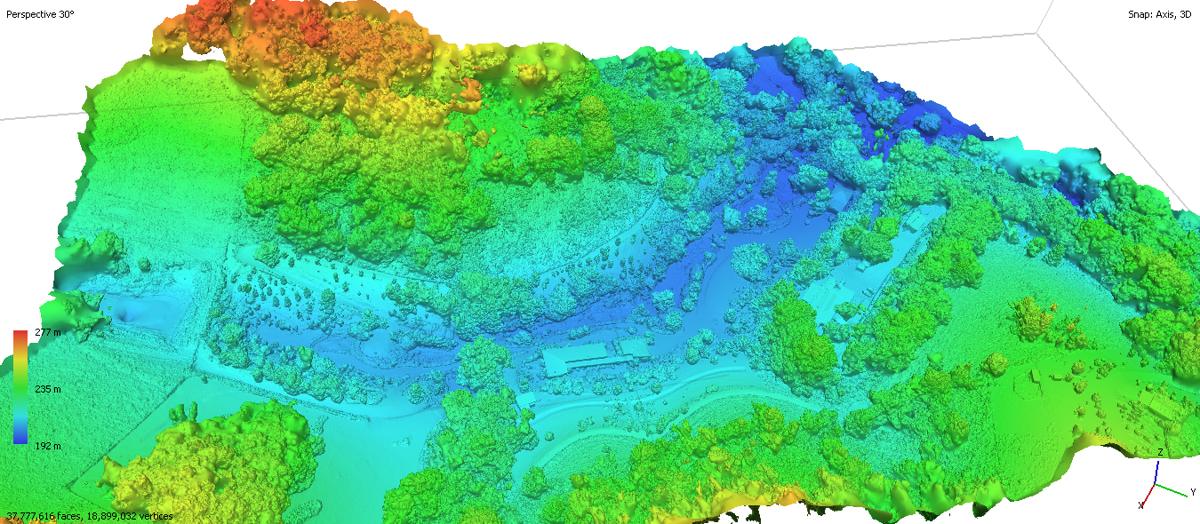
Over long grass, crops and trees, the captured data shows the top of the vegetation rather than the ground beneath. If that matters for your levels, we'll talk through the options with you.
Standing water hides the surface below it, so we don't report levels on water. Those areas are clearly marked on your map.
We plan each flight around the forecast so your data is captured in good conditions. If the weather doesn't suit on the day, we'll be in touch to arrange a new time that works for you.
Our mapping is for planning, measuring and monitoring. For cadastral or boundary surveys and set-out, we're happy to work alongside your registered surveyor.