
Cooroy House: a year of change from the air
Repeat drone mapping of a hinterland property near Cooroy, flown through the seasons so the owner can see how the land and vegetation change.
Hinterland acreage near Cooroy, in the Noosa hinterland.
4, from December 2025 to September 2026.
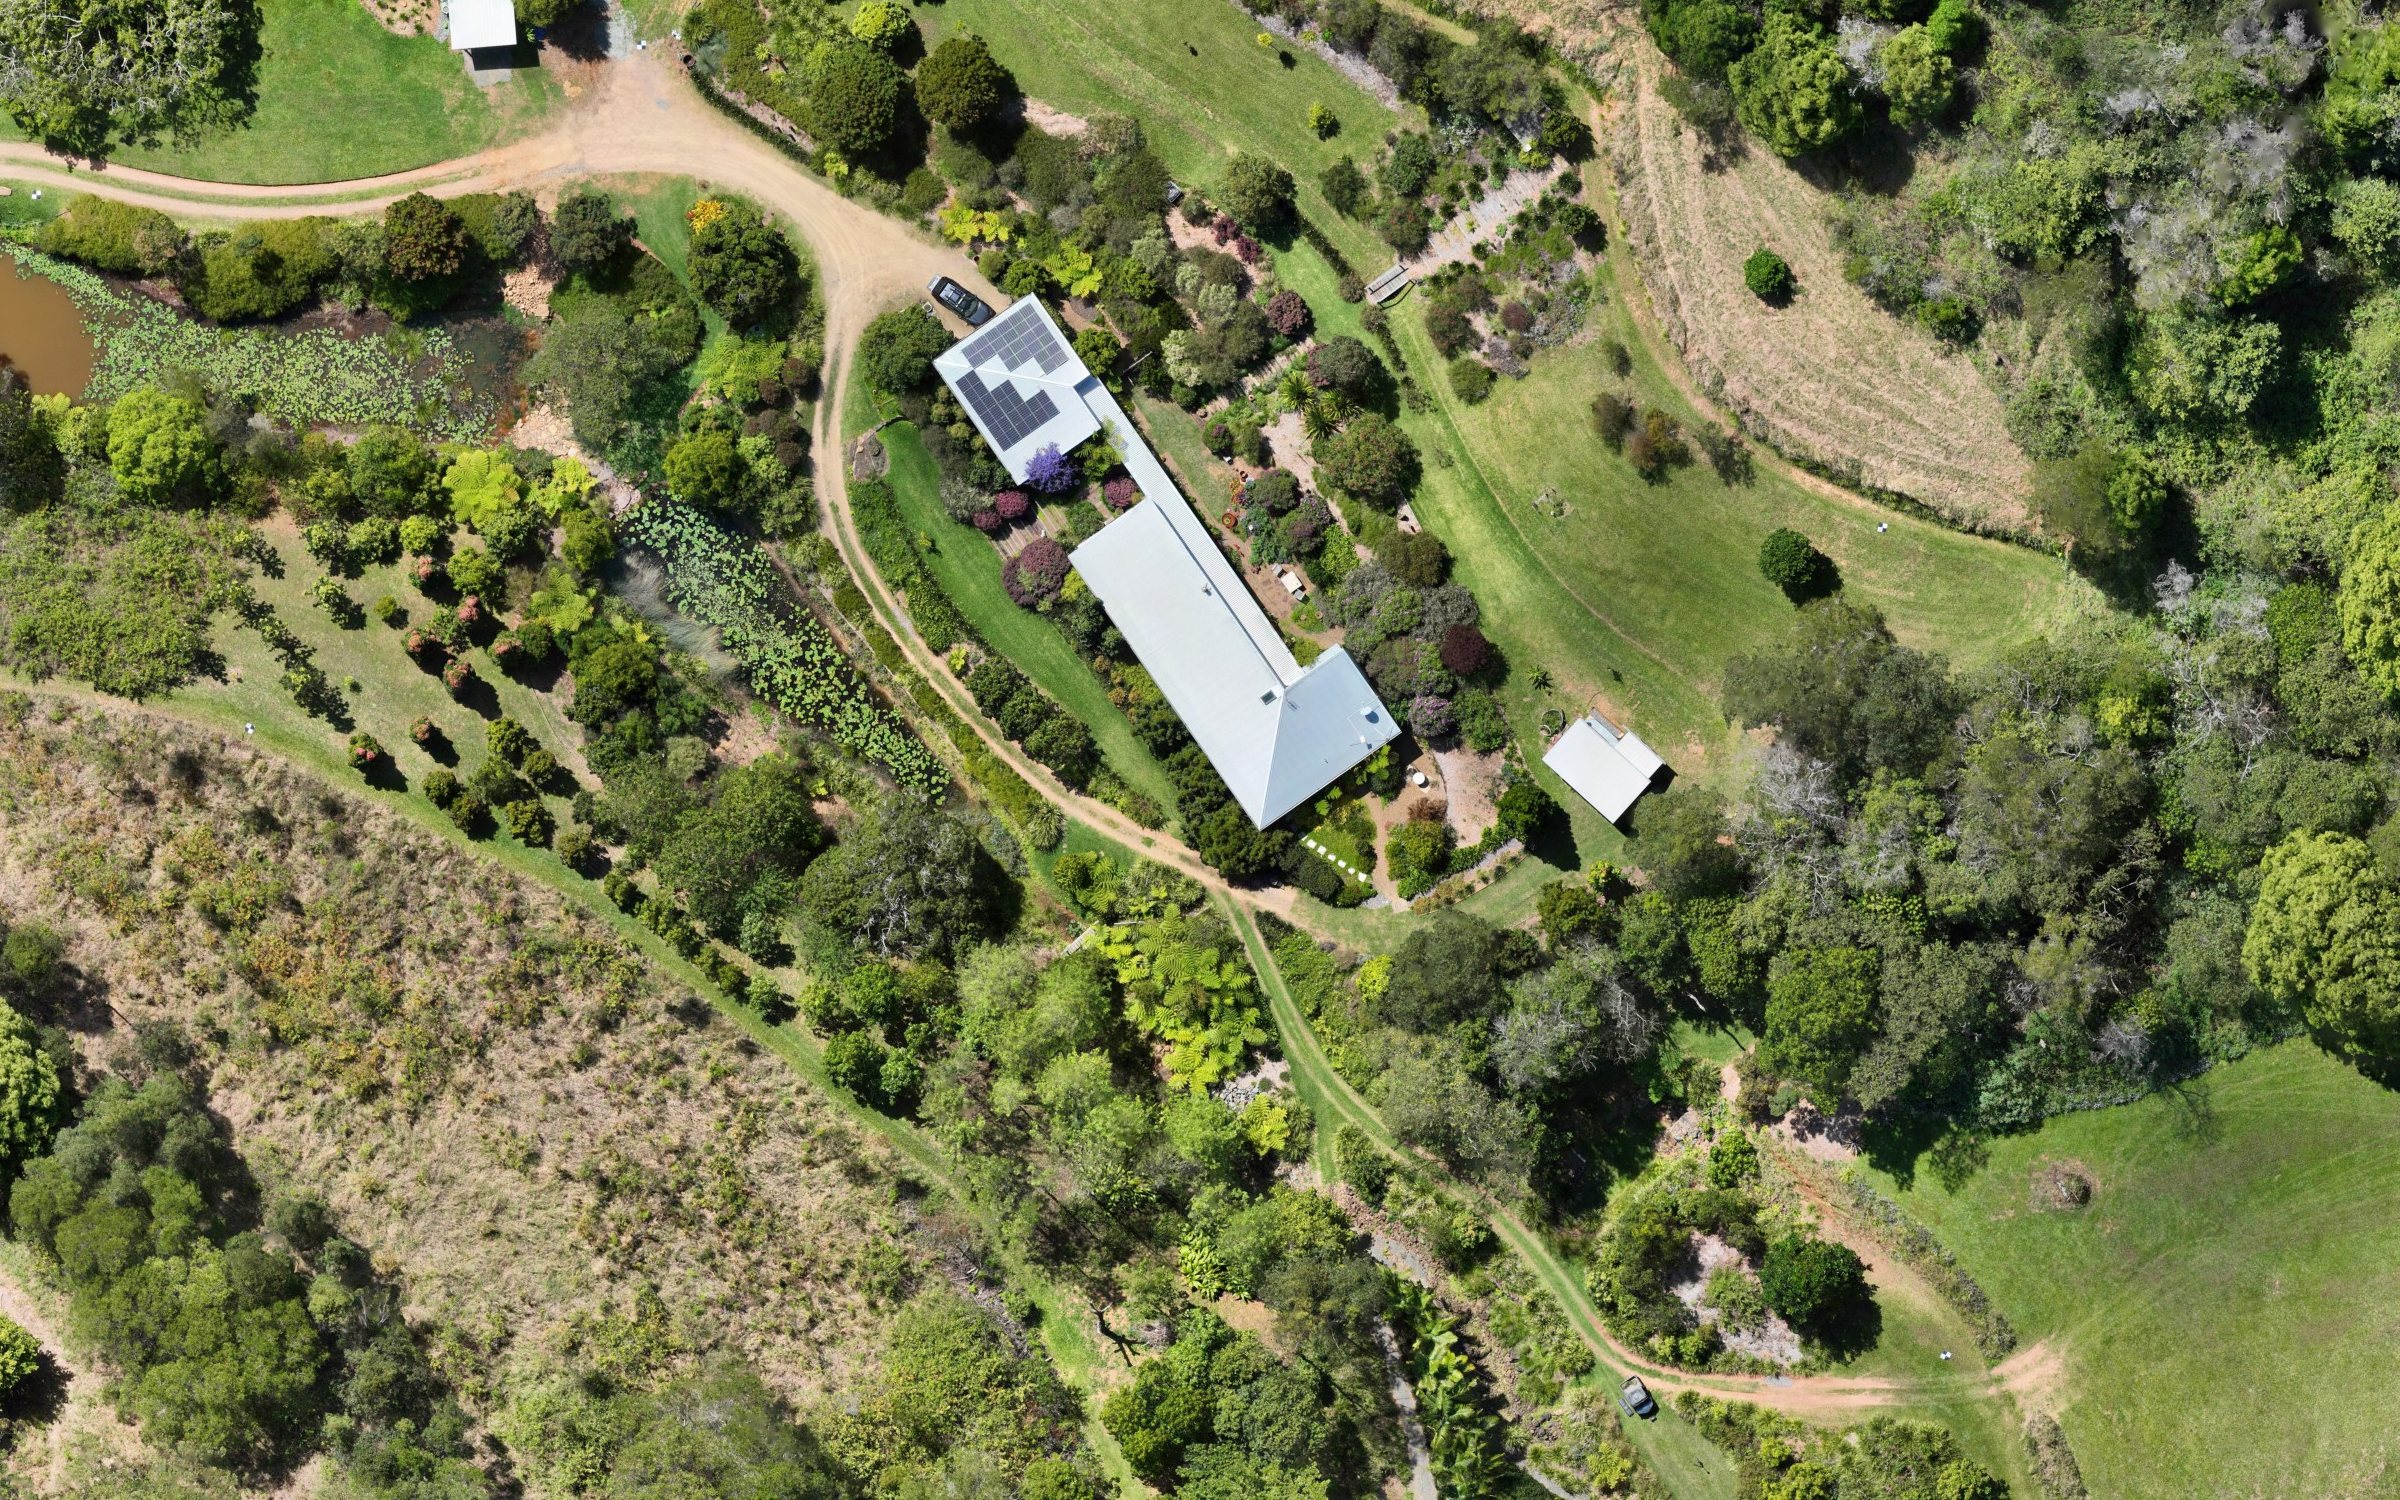
A steep hinterland block: house and sheds, gardens, orchard rows, dams, bushland and open paddock.
An orthophoto at each visit, lined up for comparison, and a map for visitors arriving at the property (in progress).
Watching a property change, season by season
The owner wanted a record of the whole property over a year: how the vegetation grows back and thins out between seasons, what changes on the ground, and how the land looks from above at each stage.
On steep, heavily vegetated hinterland ground, walking the property only shows you what's in front of you. A map from above shows the whole place at once, and repeat maps show what moved.
First map and latest map
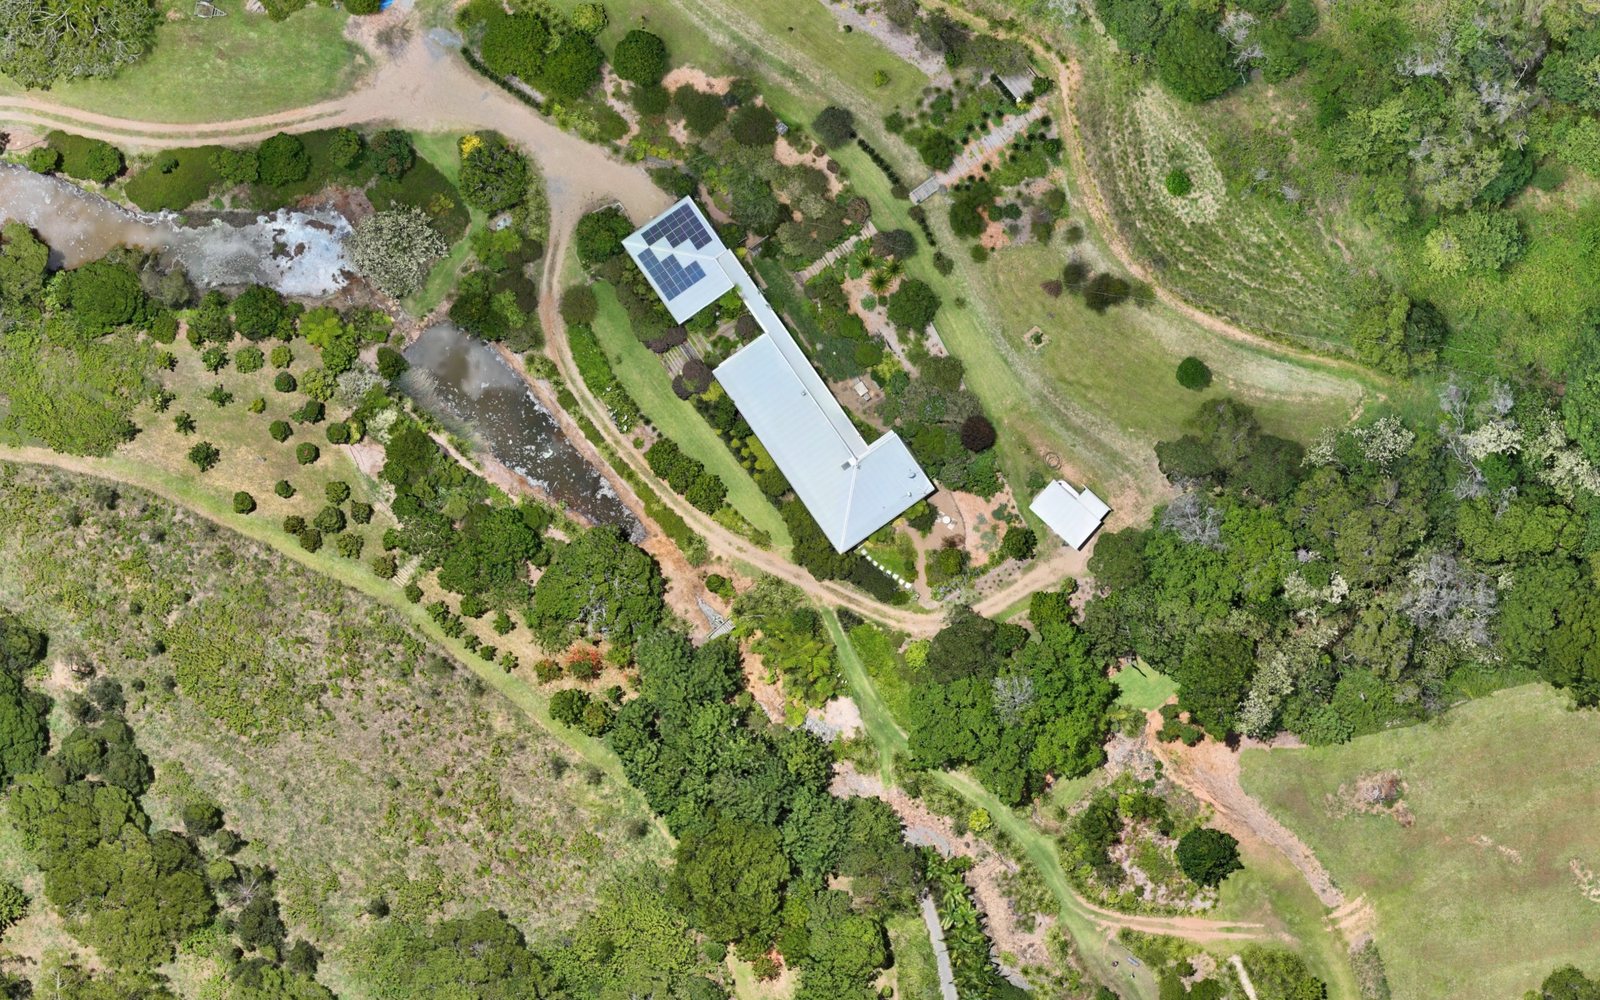
December 2025 and September 2026, lined up on the same ground. Drag the line across the map.


December 2025 (left) and September 2026 (right). Drag the line to compare.
The same plan, every visit
Each visit flies the same mapping plan over the whole property on an RTK workflow, so every orthophoto lines up with the last one and a change in the picture is a change on the ground, not a shift in the map.
The flights are planned around the terrain: steep slopes, tall trees along the gullies and a house and sheds in the middle of the site. Each capture is flown around the middle of the day to keep shadows short under the canopy.
For the comparison on this page, the first and latest orthophotos were matched to each other on things that don't move, such as roof corners, sheds and track edges. Matched features line up to about 0.1 m, and nine in ten to within about 0.2 m, so what you see change in the slider is the ground, not the map.
The property in 3D
A flyover of the full-detail 3D model, built from the drone photos of one capture. Every tree, roof and track is modelled, not drawn.
December 2025 to September 2026
The dams beside the driveway, open water in December, are thick with water plants by September, and the garden beds around the house have filled in and come into flower.
Further down the property, outside this view, a stand of trees and scrub in the lower paddock in December has been cleared by September. Drag the line slowly across the house and the dams to see the rest.
These are visual changes, read from the orthophotos. Measuring how much the ground rose or fell, or how much material moved, takes elevation models from each visit compared on ground that didn't change, and the report then states how well the two captures agree.
A map for visitors
Using the latest orthophoto, we're preparing a simple map for people arriving at the property: the entrance, driveway, parking and the buildings they're looking for, drawn over an up-to-date picture of the place.